Home / Library / Patient Safety / Quality Tool: Cause-Effect Diagram
Article

Quality Tool: Cause-Effect Diagram

<p><strong>Author’s Tip</strong></p> <p><em>Re-read <a href="http://sureshlulla.com/2020/08/12/structured-quality-improvement-problem-diagnosis/">Quality Capsule 6</a> – Structured Quality Improvement: Problem Diagnosis.</em></p> <p><strong>Basics</strong></p> <p>In <a href="http://sureshlulla.com/2020/09/16/quality-tool-brainstorming/">Quality Capsule 11</a> we were introduced to the power of right-brain Brainstorming. In other words, creative thinking. Creative thinking is the basis for developing an innovative solution / remedy.</p> <p>I also hope you have researched Imaginary Brainstorming and Brainwriting 6-3-5. These two techniques generate a flood of ideas.</p> <p>In this Quality Capsule on Cause-Effect Diagram, I wish to introduce a tool that can establish a roadmap for testing hypotheses (ideas generated in Brainstorming). The most important consideration in a cause-effect diagram is having a clear understanding of the logical relationship between cause and effect.</p> <p>It should be noted that a cause-effect diagram will not indicate which causes are creating a problem. All the potential causes are factored in. Further, it will not be known how much each is contributing to the problem. Measurement will be done as a next step, when relevant data are gathered and analysed with respect to one or more hypotheses on the cause-effect diagram.</p> <p>Please note, the cause-effect diagram facilitates team communication with the Quality Council. This is the USP of this tool.</p> <p><strong>Cause-Effect Diagram / Fishbone Diagram</strong></p> <p><img alt="" src="http://sureshlulla.com/blog/wp-content/uploads/2020/09/Quality-Capsule_Inside-Article-Diagram-012.png" /></p> <p><strong>Potential Pitfalls and Problems in Interpretation</strong></p> <p>The most serious misinterpretation of a cause-effect diagram is to confuse the orderly arrangement of hypotheses as being real data.</p> <p>Another common pitfall is to begin construction of the diagram before the symptoms of the chronic problem have been analysed as thoroughly as existing information will permit.</p> <p>A final pitfall is to limit the hypotheses for rapid construction of the cause-effect diagram.</p> <p><strong>Insight</strong></p> <p>The cause-effect diagram does not provide an answer to a question, as some other tools do. Its main value is to serve as a vehicle for organizing a list of all known or suspected causes that potentially contribute to the observed effect (the symptom of the chronic problem).</p> <p>The cause-effect tree (known to IT professionals) is conceptually similar to the cause-effect diagram.</p>

quality-tool-cause-effect-diagram.pdf
/ 18
100%
Knowledge
today for a
safer tomorrow

Quality Tool: Cause-Effect Diagram

Patient Safety

Author’s Tip Re-read Quality Capsule 6 – Structured Quality Improvement: Problem Diag...

About this resource

<p><strong>Author&rsquo;s Tip</strong></p>

<p><em>Re-read&nbsp;<a href="http://sureshlulla.com/2020/08/12/structured-quality-improvement-problem-diagnosis/">Quality Capsule 6</a>&nbsp;&ndash; Structured Quality Improvement: Problem Diagnosis.</em></p>

<p><strong>Basics</strong></p>

<p>In&nbsp;<a href="http://sureshlulla.com/2020/09/16/quality-tool-brainstorming/">Quality Capsule 11</a>&nbsp;we were introduced to the power of right-brain Brainstorming. In other words, creative thinking. Creative thinking is the basis for developing an innovative solution / remedy.</p>

<p>I also hope you have researched Imaginary Brainstorming and Brainwriting 6-3-5. These two techniques generate a flood of ideas.</p>

<p>In this Quality Capsule on Cause-Effect Diagram, I wish to introduce a tool that can establish a roadmap for testing hypotheses (ideas generated in Brainstorming). The most important consideration in a cause-effect diagram is having a clear understanding of the logical relationship between cause and effect.</p>

<p>It should be noted that a cause-effect diagram will not indicate which causes are creating a problem. All the potential causes are factored in. Further, it will not be known how much each is contributing to the problem. Measurement will be done as a next step, when relevant data are gathered and analysed with respect to one or more hypotheses on the cause-effect diagram.</p>

<p>Please note, the cause-effect diagram facilitates team communication with the Quality Council.&nbsp;This is the USP of this tool.</p>

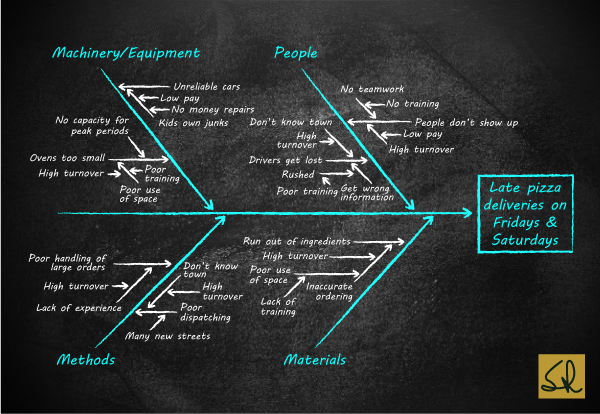
<p><strong>Cause-Effect Diagram / Fishbone Diagram</strong></p>

<p><img alt="" src="http://sureshlulla.com/blog/wp-content/uploads/2020/09/Quality-Capsule_Inside-Article-Diagram-012.png" /></p>

<p><strong>Potential Pitfalls and Problems in Interpretation</strong></p>

<p>The most serious misinterpretation of a cause-effect diagram is to confuse the orderly arrangement of hypotheses as being real data.</p>

<p>Another common pitfall is to begin construction of the diagram before the symptoms of the chronic problem have been analysed as thoroughly as existing information will permit.</p>

<p>A final pitfall is to limit the hypotheses for rapid construction of the cause-effect diagram.</p>

<p><strong>Insight</strong></p>

<p>The cause-effect diagram does not provide an answer to a question, as some other tools do. Its main value is to serve as a vehicle for organizing a list of all known or suspected causes that potentially contribute to the observed effect (the symptom of the chronic problem).</p>

<p>The cause-effect tree (known to IT professionals) is conceptually similar to the cause-effect diagram.</p>
back to top